Introduction
It is no surprise, nor a secret, that most Americans vote with their pocketbook in mind. According to the Pew Research Center in a poll from September 9th of this year, the greatest concern among both Trump and Harris supporters is the economy. The next greatest issue, health care, is only ranked at highly concerning to 65% of voters, compared to the 81% when asked about the American economy.[1]
Today, I will walk you through analysis of the American economy, how it has historically connected with elections, and how I expect it will influence future elections.
Understanding Historical Results
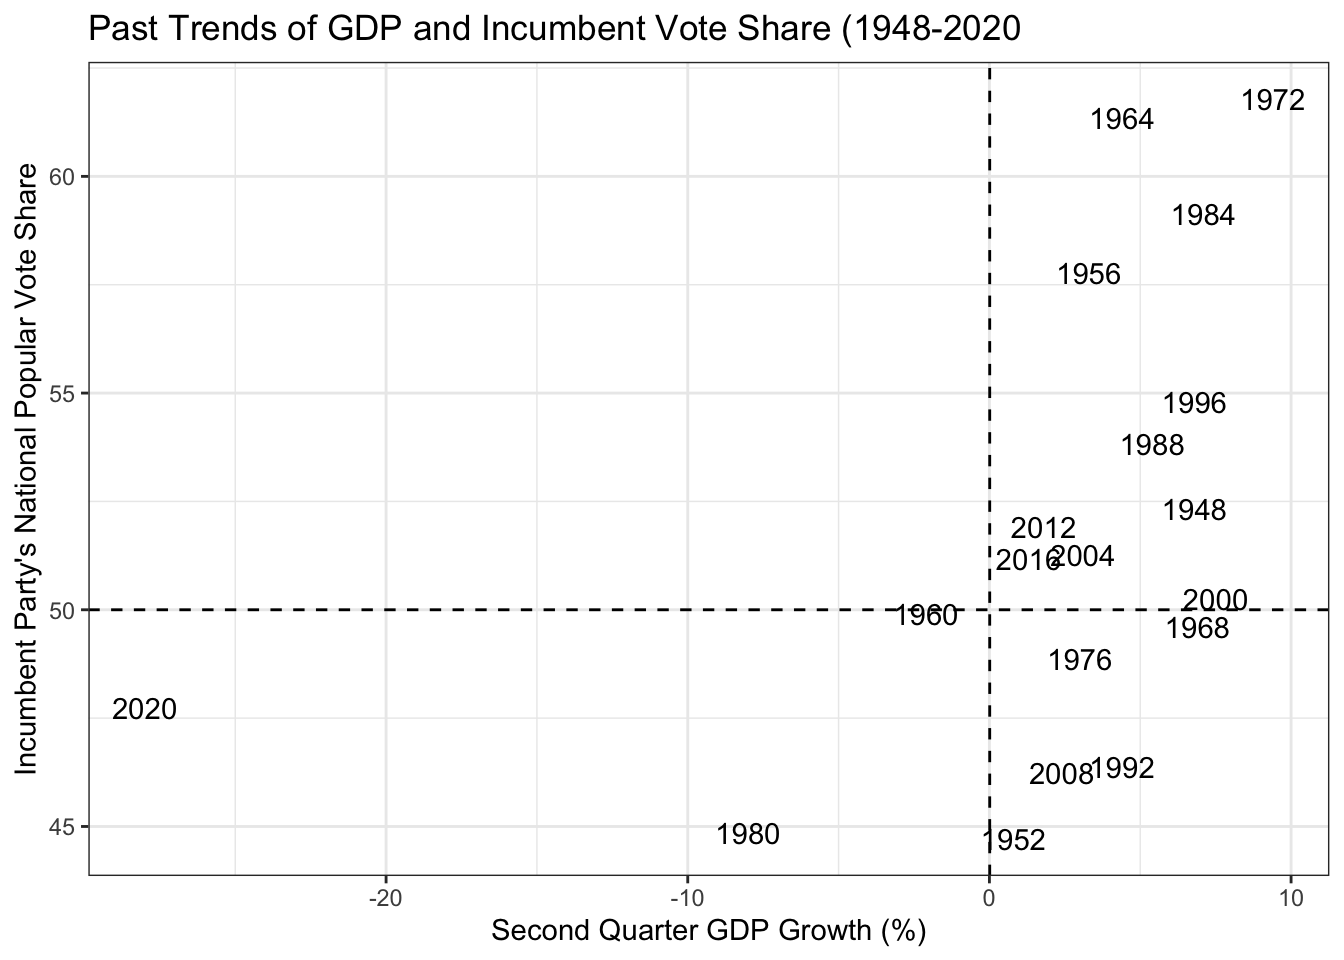
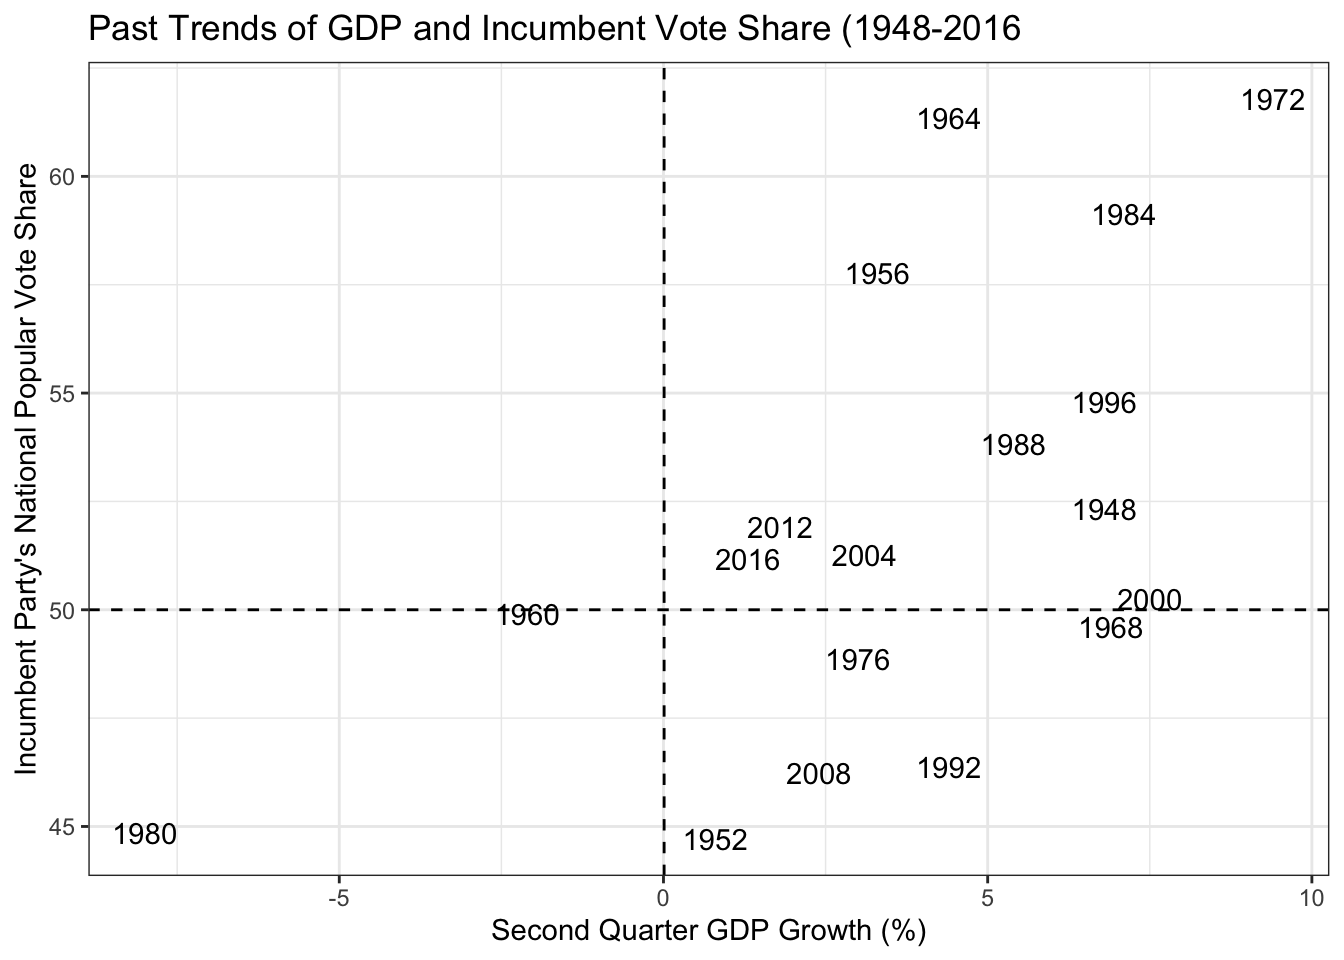
In the graph below, you will see historical trends with the X-axis consisting of GDP growth by quarter, and the Y-axis indicating the incumbent party’s national popular vote share. Specifically, the data in the X-axis comes from the second economic quarter (Q2) of an election year. Q2 was selected based on the idea of retrospective voting, where citizens consider past (and generally quite recent) history to decide how to vote now. In 1980, President Reagan embodied the retrospective voter well, asking “are you better off now than you were four years ago?” He reminded voters that incumbent Jimmy Carter was to blame for the past four years of turmoil, and who to celebrate for the past four of accomplishments. Luckily for Reagan, voters weighed Carter’s failures higher than his accomplishments, eventually leading to Reagan’s November win. You will see in the graph below how our data demonstrates that 1980 result. One clear issue is that of 2020, which perhaps adds a flavor of confusion to the seemingly positive correlation. So, what happened in 2020? Growth was slow, as Covid-19 led to some tough times financially. Companies were still shuttered, and it was not easy to both obey social distancing restrictions and run a functioning business. This does, however, make sense when you consider that growth was down, so the incumbent received a low share of the popular vote. Just because the difference in GDP growth is so substantial compared to other years, the general idea holds true! You will see the second graph in fact removes 2020 from the equation to draw a stronger picture.
Linear Regression Model
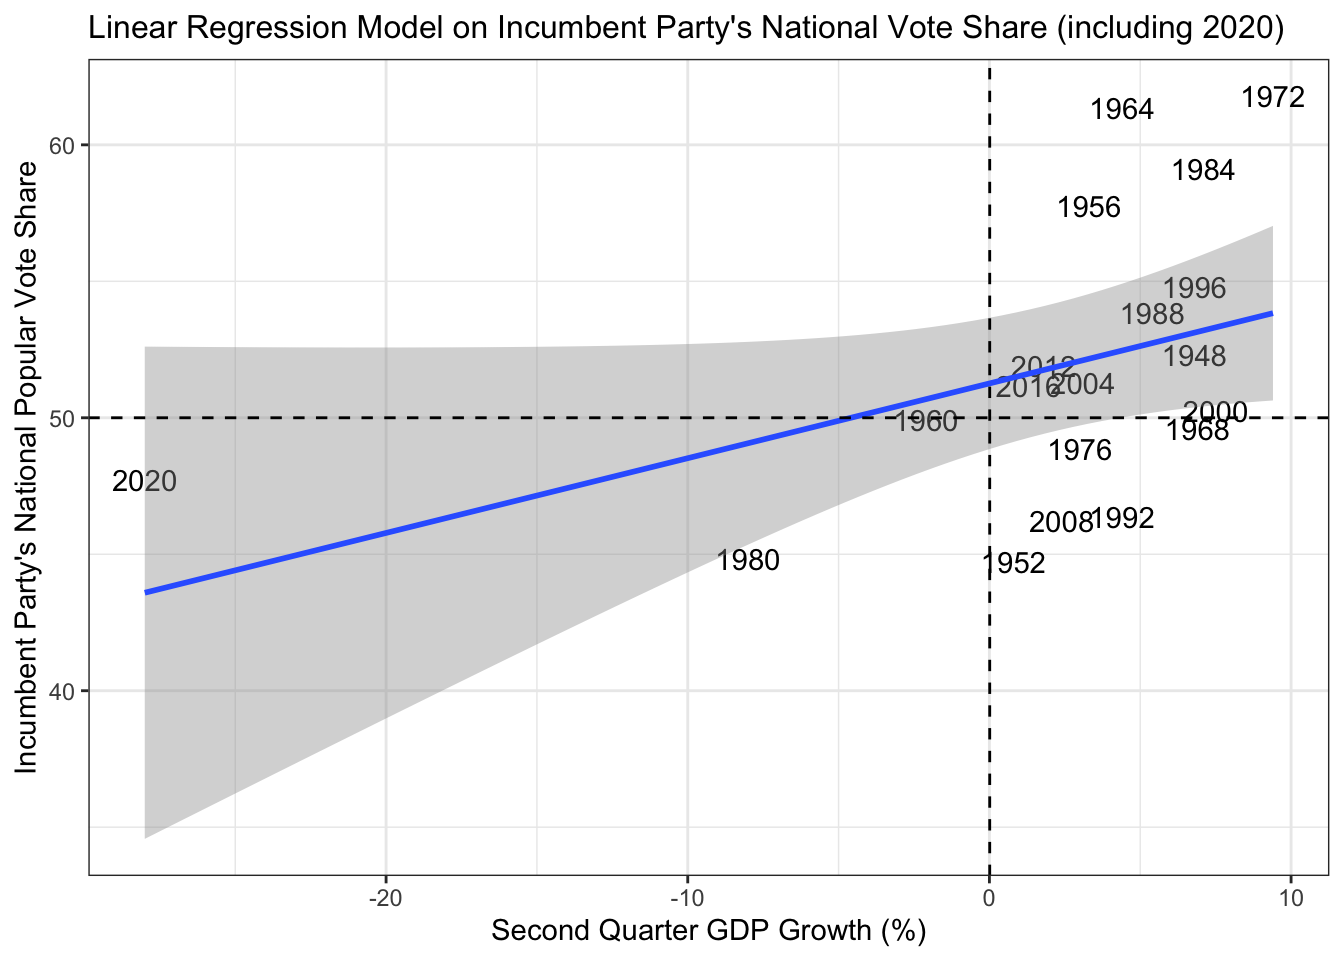
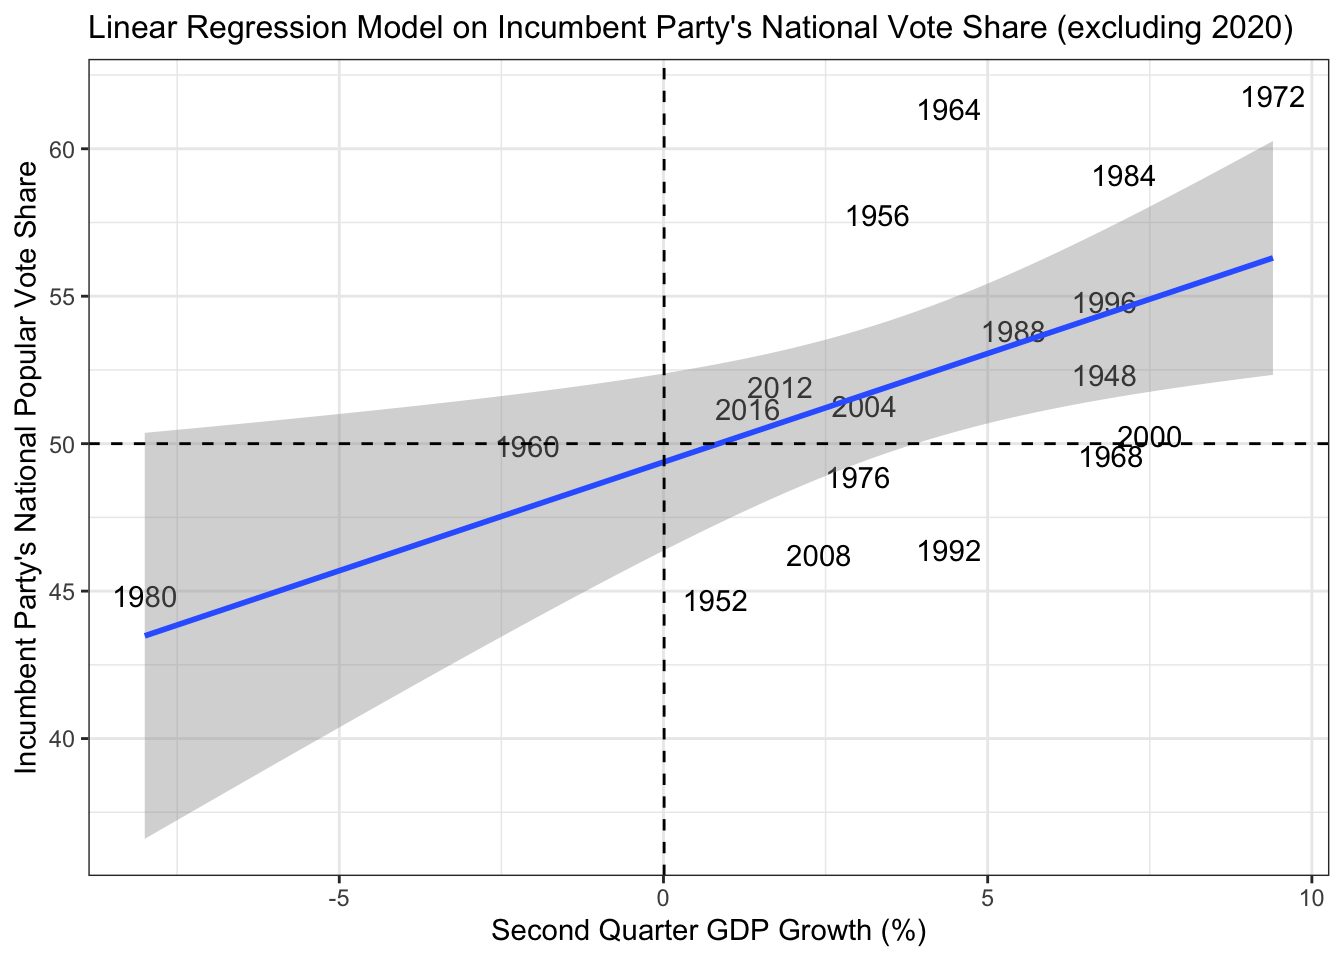
Then, as you will see below the same two graphs, but now with linear regression models attached. See the equation as well as line for each!
R Squared
Looking above, you will see two graphs with different R^2. R^2 can be used to analyze how closely connected the independent variable is to the dependenent, signifiying how well the dependent can predict the independent.The graph including the 2020 data point has an R^2 value of 0.188, while the updated graph (without 2020) has a R^2 of 0.324.
## [1] 0.1880919
## [1] 0.3248066
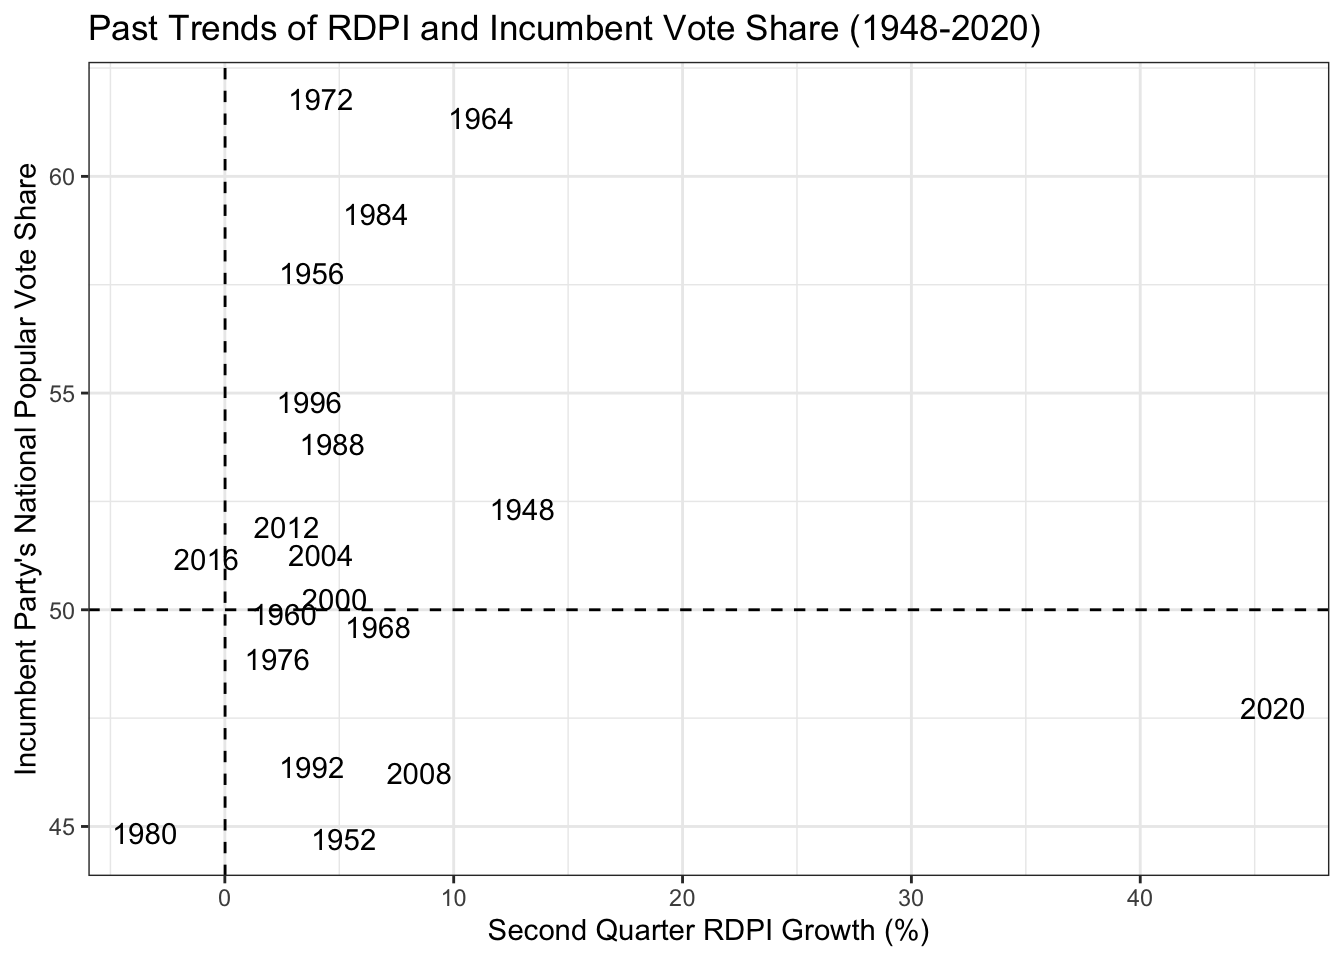
RDPI Comparison
Interestingly, when evaluating a different economic factor, this time quartlerly Real Disposable Personal Income, there is incredibly little explanation. With a p-value of 0.822, it is clear that RDPI is not a reliable indicator of voting outcomes.
Projections for 2024
Below, you will see a 2024 prediction using the previously created linear regression model. Remember that this is based on the rate of increase in GDP (gross domestic product) from the second financial quarter of 2024. This data is demonstrating what share the incumbent party will receive, so we see that Democrats will narrowly win, with 51.5% of the popular vote share!
##        fit      lwr     upr
## 1 51.58486 41.85982 61.3099
Conclusion
As you saw with the RDPI growth, not all economic factors are equally weighed when citizens go to the polls. Disposable Personal Income is all of the money a person has to spend after they pay taxes. It is difficult to know precisely why citizens weigh GDP much heavier than RDPI, but one possible answer is because of nationalism. In recent years, with an industrial race between the US and China and other nations, our standing on the international stage is greatly caused by the national GDP. Thanks to this, the national news media focuses heavily on GDP when they comment on the current success of the President. With the letters GDP constantly playing over the TV, it is not suprising that citizens weigh it quite heavily compared to other factors.
Sources: 1: https://www.pewresearch.org/politics/2024/09/09/issues-and-the-2024-election/ Code written in consultation with TF Matthew Dardet in 1347 Lab Session, as well as with the ultimate wisdom and guidance of fellow student Kaitlyn Vu.